The stock market sold off today.
Oil prices spiked.
Bond yields rose.
Almost everything fell — stocks, bonds, emerging markets, gold, bitcoin, seemingly everything but the dollar.
Investors are trying to figure out what the war in Iran means for the markets.
Higher inflation? Higher borrowing costs? Higher energy prices?
How long will this conflict last? What are the geopolitical implications? Will it all blow over in short order?
I have no idea. That’s not my lane. I’m not sure anyone knows.
The stock market’s reaction to these events can be counterintuitive.
I wrote about the relationship between war and the stock market back in 2020:
In the six months following the onset of World War I in 1914, the Dow fell more than 30%. Because the war basically ground the business world to a halt and market liquidity all but dried up, the decision was made to close the stock market that year. This lasted for six months, the longest such period on record. Making up for lost time, the Dow rose more than 88% in 1915 after it reopened, which remains the highest annual return on record for the DJIA. In fact, from the start of the war in 1914 until the war ended in late 1918, the Dow was up more than 43% in total or around 8.7% annually.
World War II had a similarly counterintuitive market outcome. Hitler invaded Poland on September 1, 1939, setting off the war. When the market opened on September 5, the Dow shot almost 10% higher that day. When the attack on the U.S. naval base at Pearl Harbor occurred in early December 1941, stocks opened up the following Monday down 2.9%, but it took just a month to regain those losses. When the allied forces invaded France on D-Day on June 6, 1944, the stock market barely noticed. The Dow rose more than 5% over the ensuing month.
From the start of WWII in 1939 until it ended in late 1945, the Dow was up a total of 50%, more than 7% per year.
So, during two of the worst wars in modern history, the U.S. stock market was up a combined 115%.
The Korean War began in the summer of 1950 when North Korea invaded the South. That conflict ended in the summer of 1953. In that time, the Dow was up an annualized 16%, or almost 60% in total.
U.S. troops were sent to Vietnam in March of 1965. The Dow would finish the remainder of that year up almost 10%. By the time the last of the U.S. troops were pulled out of Vietnam in 1973, the stock market was up a total of almost 43% in that time, or just under 5% per year.
I’ve written about how the markets have responded to prior geopolitical crises as well:
The Cuban Missile Crisis had the world on the brink of nuclear war in October of 1962. The confrontation lasted 13 days from Oct. 16, 1962, to Oct. 28. In that two-week period the Dow remained surprisingly calm, losing just 1.2 percent. For the remainder of that year the Dow would gain more than 10 percent.
President John F. Kennedy was assassinated a little more than a year later in Dallas. The market opened up 4.5 percent the day after. Stocks finished up the following year, 1964, more than 15 percent.
Stocks dropped 13.3 percent in the three weeks following the Gulf War in the summer of 1990. From July of that year through October, the S&P 500 dropped 19.9 percent, but this also coincided with a recession.
The attack on U.S. soil on Sept. 11, 2001, saw stocks fall sharply, down almost 15 percent in less than two weeks following the tragedy. The economy was already in the middle of a recession at that point and stocks were still falling from the technology bubble, but within a couple of months the stock market had made back all of its losses from Sept. 11.
The U.S. invaded Iraq in March 2003. Stocks rose 2.3 percent the following day and finished up the year with a gain of more than 30 percent from that point on, though this followed the end of a brutal bear market.
Forecasting the length and severity of war always seems easier with the benefit of hindsight, just like it is with markets.
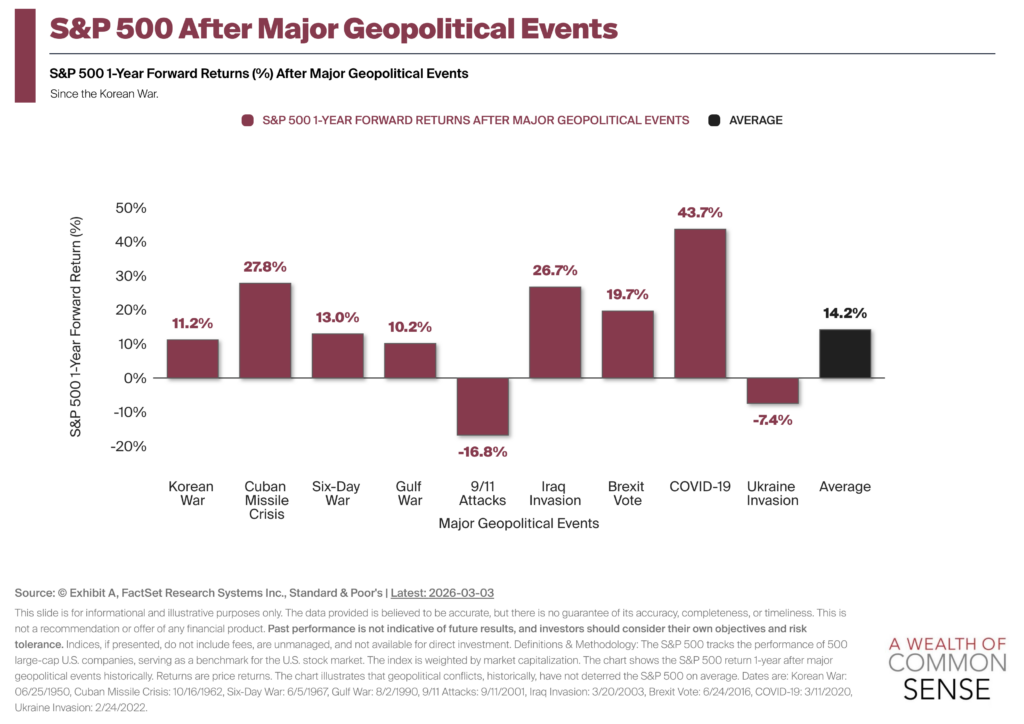
This chart from Exhibit A shows how the stock market has performed in the 12 months following major geopolitical events going back to the Korean War:
Most of the time the stock market goes up but sometimes it goes down applies here too.
As always.
Further Reading:
The Relationship Between War & the Stock Market