I like playing the odds when it comes to the stock market.
I’m a long-term investor because it increases your odds of success. There are no guarantees but the short-term is far more volatile than the long-term.
But the odds in the stock market are not static. These things are constantly changing and the results are heavily reliant on the time frame you use.
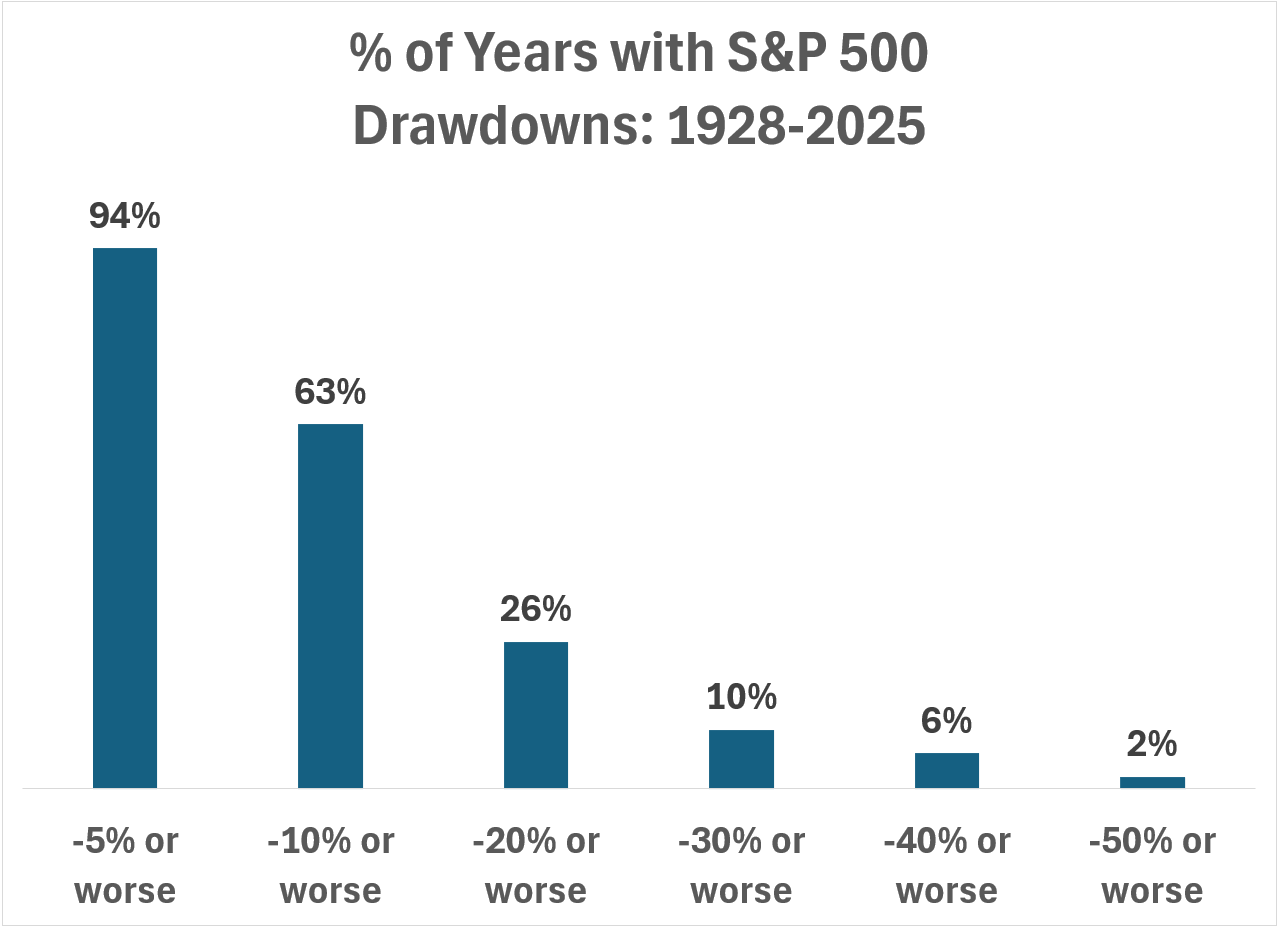
For example, over the last 100 years or so the S&P 500 has experienced a peak-to-trough drawdown of 10% or worse in two-thirds of all years. You would have seen a 5% correction in 94% of all years and a 20% drawdown in 1 out of every 4 years.
These are the long-term averages:
However these averages are skewed by the early part of the data. Just look at how much worse things were in the 1928-1950 period:
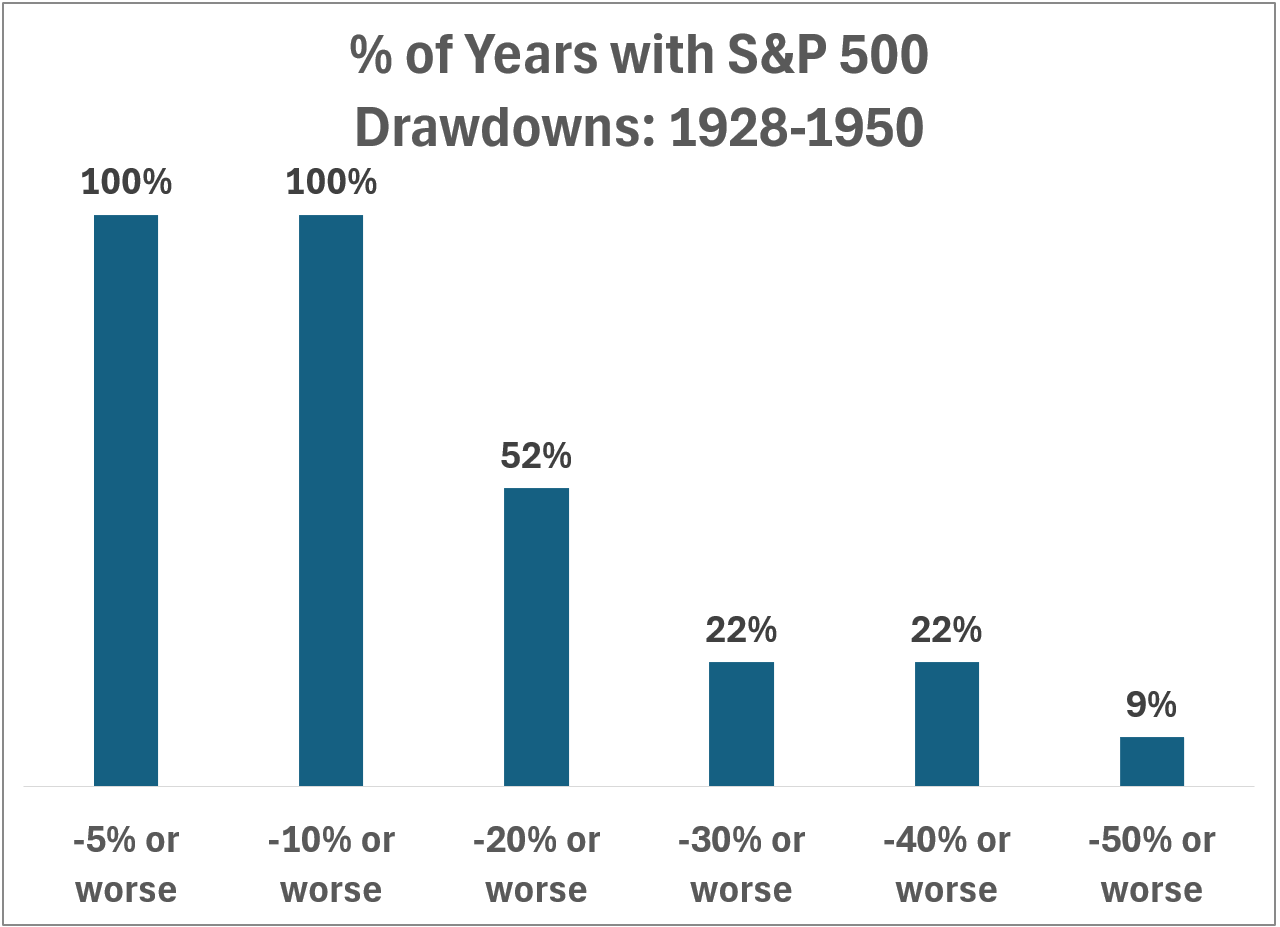
Every single year had a 10% correction. Half of all years had an intrayear bear market!
This makes sense since this time frame included the Great Depression and World War II.
Now look at the ensuing 75 years of data:
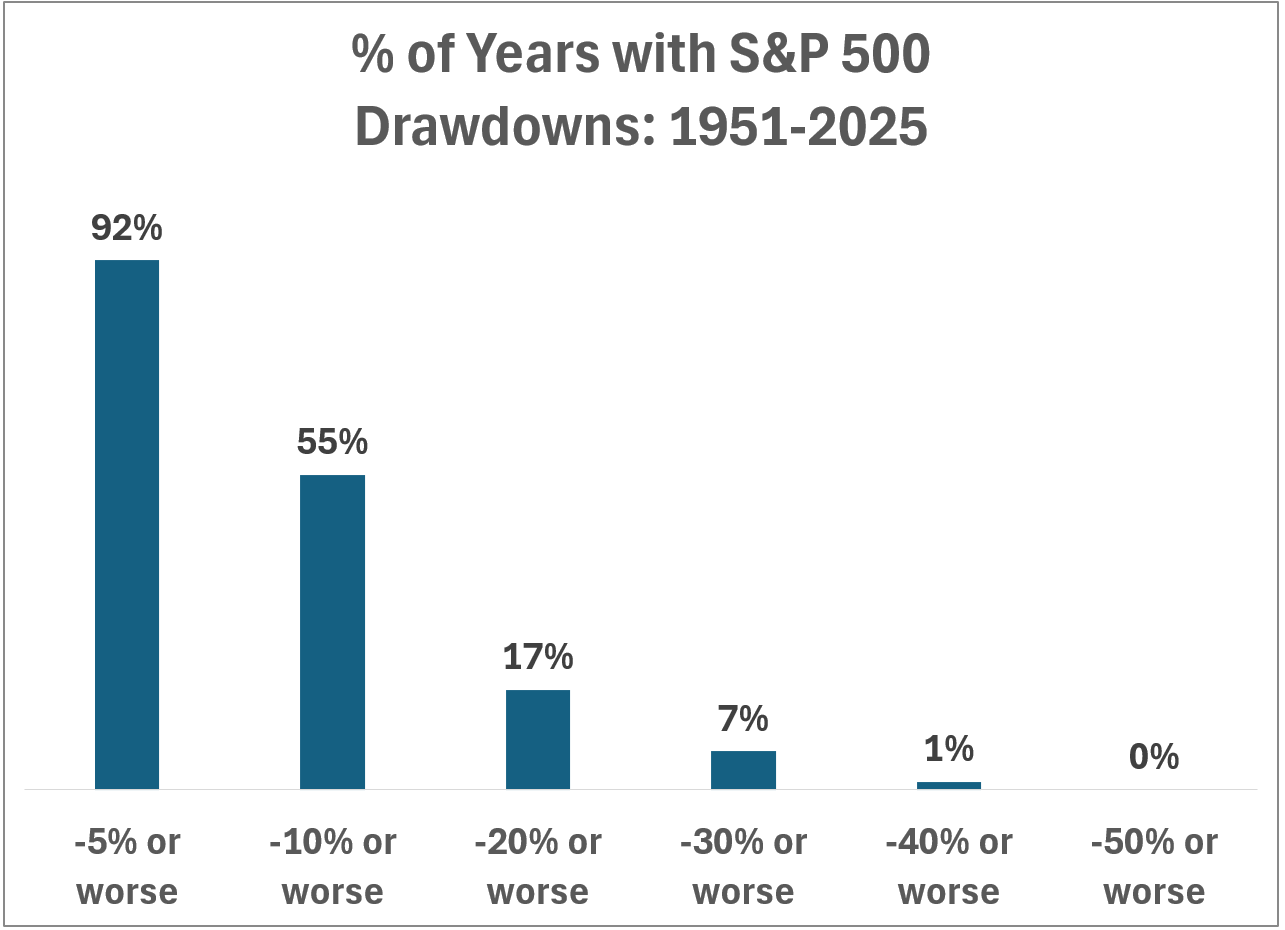
That’s more like it.
The second dataset is probably more applicable to investors today. There are a lot of structural reasons why I think another 1929 won’t happen.
However, the post-WWII era still has plenty of scary periods. It feels like a lifetime ago, but there were two 50% crashes in the first decade of this century.
Despite the bull market, we’ve essentially had three bear markets in the 2020s (Covid, 2022 and Liberation Day).
These long-term averages are helpful in terms of context but it’s important to remember that risk can be lumpy just like returns.
Historical data offers a useful reminder that despite incredible long-term gains in the stock market, there have been plenty of setbacks along the way.
Losses always have been and always will be a big part of investing in the stock market.
Michael and I talked about possible gains and losses for the stock market in 2026 and much more on this week’s Animal Spirits video:
Subscribe to The Compound so you never miss an episode.
Further Reading:
Investing for the Long-Term
Now here’s what I’ve been reading lately:
Books:
This content, which contains security-related opinions and/or information, is provided for informational purposes only and should not be relied upon in any manner as professional advice, or an endorsement of any practices, products or services. There can be no guarantees or assurances that the views expressed here will be applicable for any particular facts or circumstances, and should not be relied upon in any manner. You should consult your own advisers as to legal, business, tax, and other related matters concerning any investment.
The commentary in this “post” (including any related blog, podcasts, videos, and social media) reflects the personal opinions, viewpoints, and analyses of the Ritholtz Wealth Management employees providing such comments, and should not be regarded the views of Ritholtz Wealth Management LLC. or its respective affiliates or as a description of advisory services provided by Ritholtz Wealth Management or performance returns of any Ritholtz Wealth Management Investments client.
References to any securities or digital assets, or performance data, are for illustrative purposes only and do not constitute an investment recommendation or offer to provide investment advisory services. Charts and graphs provided within are for informational purposes solely and should not be relied upon when making any investment decision. Past performance is not indicative of future results. The content speaks only as of the date indicated. Any projections, estimates, forecasts, targets, prospects, and/or opinions expressed in these materials are subject to change without notice and may differ or be contrary to opinions expressed by others.
The Compound Media, Inc., an affiliate of Ritholtz Wealth Management, receives payment from various entities for advertisements in affiliated podcasts, blogs and emails. Inclusion of such advertisements does not constitute or imply endorsement, sponsorship or recommendation thereof, or any affiliation therewith, by the Content Creator or by Ritholtz Wealth Management or any of its employees. Investments in securities involve the risk of loss. For additional advertisement disclaimers see here: https://www.ritholtzwealth.com/advertising-disclaimers
Please see disclosures here.