Here are 7 of the biggest risks from the past 100 years or so of financial markets:
1. Following the Roaring 20s the U.S. stock market peaked in September 1929. Over the next three years or so the stock market would fall 86%.
A $1 million portfolio would have turned into $140,000.
2. The 1970s inflation was absolutely brutal for households and investors alike. The inflation rate averaged nearly 8% per year that decade, which was higher than the returns for both U.S. stocks and government bonds.
From 1966 to 1981, the U.S. stock market lost money on an inflation-adjusted basis.
3. The U.S. stock market has finished the month down 20% or worse six times over the past 100 years:
- September 1931 -29.7%
- March 1938 -24.9%
- May 1940 -22.9%
- May 1932 -22.0%
- October 1987 -21.5%
- April 1932 -20.0%
There have been four times in which the stock market has fallen 10% or worse in a single day.
4. The U.S. stock market experienced a lost decade in the first 10 years of the 21st century. The S&P 500 was down around 10% in total from 2000 to 2009, bookended by two of the largest crashes in history with two recessions to boot.
5. Not to be outdone, the Japanese stock market wasn’t happy with just one lost decade. After a rip-roaring bubble in the 1980s, the Nikkei peaked at the tail end of 1989.
It didn’t technically bottom until March…of 2009.
New highs weren’t reached again until 2024, a staggering 34 years later.
6. By my calculations there have been 14 bear markets caused by a recession since 1928. The average drawdown during these recessionary bear markets was -39.4%.
7. Since 1950, the S&P 500 has reached a new all-time high in 7% of all trading days. Said another way, 93% of the time the market was in a state of drawdowns.
More than one-third of the time, the stock market has been down 10% or worse.
The market has spent nearly 17% of the time down 20% or more from all-time highs.
I could keep going with this list. There has been a lot of pain in the financial markets over the years.
How do you plan for this kind of market pain?
Could we experience similar market environments going forward?
How do you survive a Japan-like situation?
How do you manage risk at different stage of life and wealth?
How do you create a durable portfolio that can see you through some turmoil?
Which risks are worth taking?
How much risk is necessary to achieve your financial goals?
How do you protect your portfolio from your own behavior?
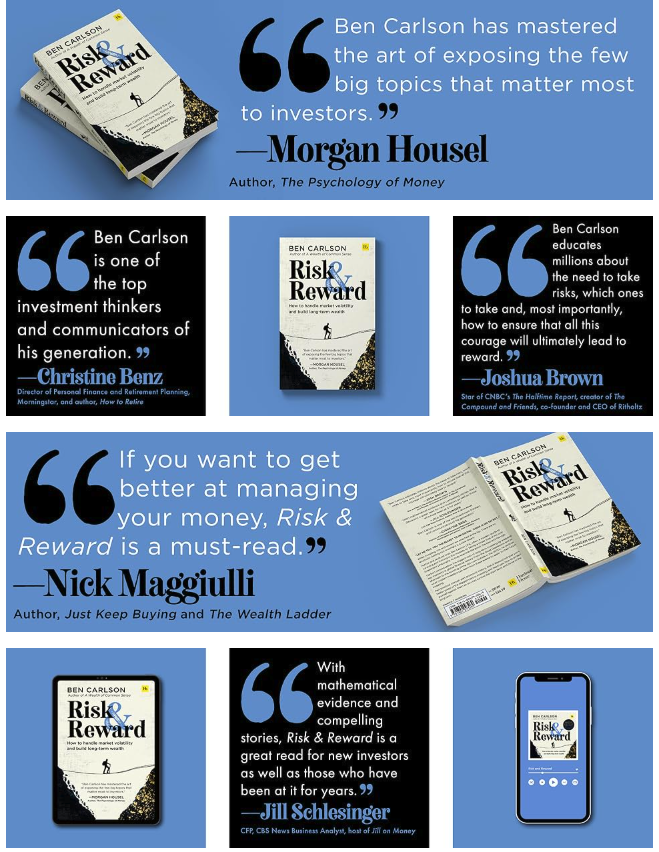
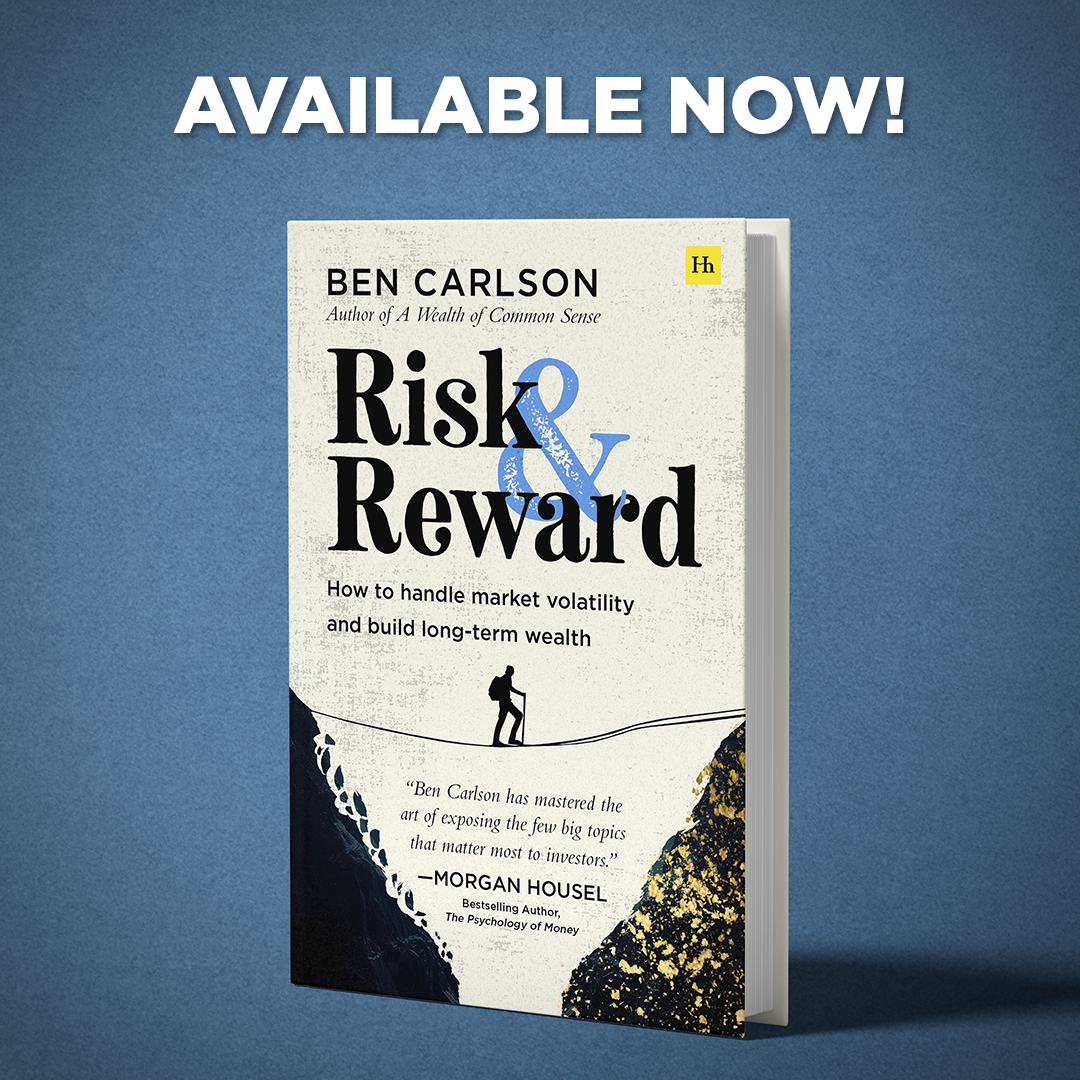
These are the questions I sought to answer in my new book — Risk & Reward: How to handle market volatility and build long-term wealth.
The book is now available. You can buy it at all of the places here.
I’ve basically been writing and thinking about the ideas in this book for the past 12 years.
The book covers the two most important variables every investor must consider:
1. Your risk profile.
2. Your time horizon.
I’ve always been big on weaving in stories and analogies to simplify complex topics but there are also a ton of visuals in the book.
I put all of my best charts, tables and data in Risk & Reward so I wanted everything to look clean. Chart Kid Matt helped me format them so they all look great and easy to read.
There are more than 50 charts, tables, graphs and other visuals in this thing.
When I was in studio recording the audio version of the book, I had a producer in my ear from London.1
About halfway through my reading of the book, we took a break and he said something to the effect of As a non-finance person I have to admit that all of the market history in your book is bit anxiety-inducing. But I also appreciate the context and long-term perspective you’re providing about these awful events.
That’s the idea of the book.
Risk and reward are attached at the hip. Every investment decision you make involves trade-offs.
I wrote this book to provide a market history lesson about the many risks involved when investing in the financial markets.
I wrote this book to remind you that the long-term rewards makes the uncomfortable short-term risks worth it in the end.
I wrote this book to help you survive the inevitable risks we experience in the future.
You can buy the book now.
1My publisher, Harriman House, is based across the pond.