A reader asks:
I was doing my net worth over the last year, and found this to be very interesting. I asked AI if the last year return of the S&P 500 of 30.6% is one of the biggest. It was not, most likely #7 or #8. Either way, this is rarified air here, and all points are we are not at the peak given the earning reports. What does your data say?
I’ve been getting a lot of questions from people recently to have me check the work done by an AI model.
I guess it’s good news that I haven’t been supplanted by the robots just yet.
I’m a sucker for a good research project on market history like this.
Let’s take the data back to 1975 just because I like round numbers.
From the start of 1975 through the end of April, the S&P 500 was up 12.5% per year.
That’s really good.
How good you might ask?
Ten thousand dollars invested in the S&P 500 at the outset of 1975 would be worth $4.2 million today. Compounding is amazing.
Now let’s dig into the one year returns in question.
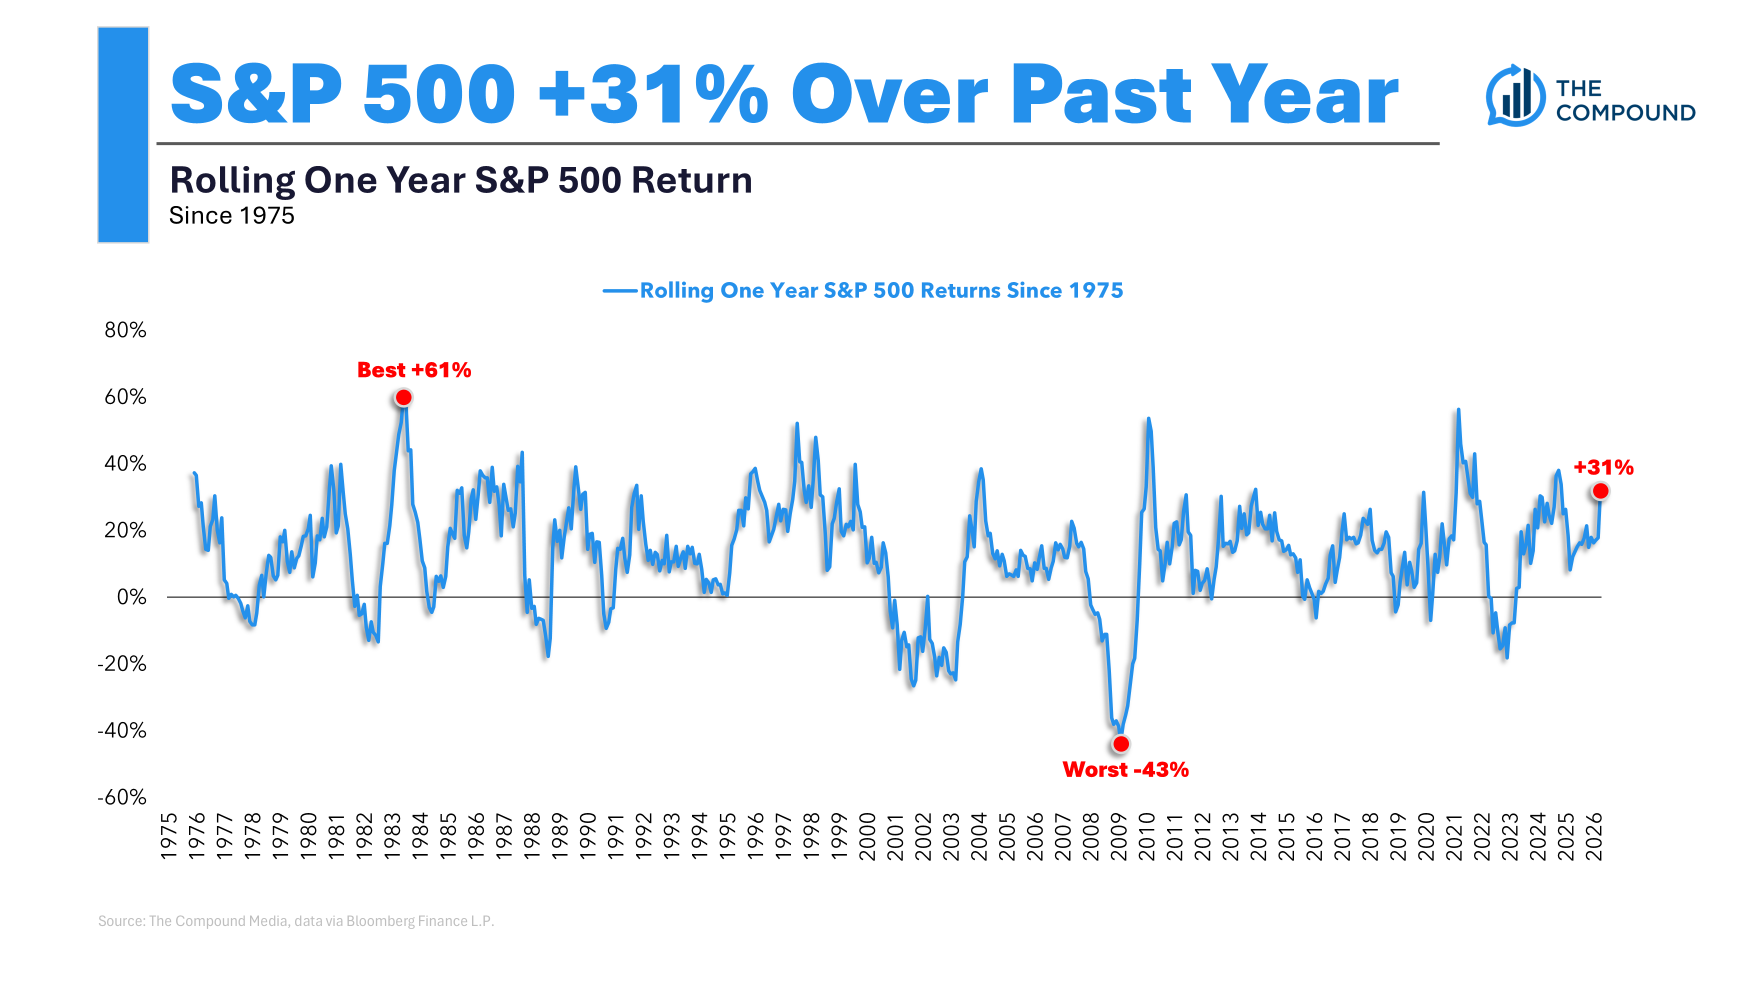
I calculated the rolling 12 month total returns on the S&P 500 going back to 1975. The stock market was in fact up 31% over the past year.
But that wasn’t even close to the best one year return of the past 50 years:
The best 12 month return was a gain of 61% which occurred in the early 1980s.
That kicked off the start of an epic bull market coming out of back-to-back recessions caused by Paul Volcker and company to finally snuff out sky-high inflation.
The worst 12 month return was a loss of 43% which took place during the Great Financial Crisis.
The 31% return of the past 12 months ranks in the 88th percentile of one year returns since 1975. Here’s the ranked distribution of one year returns since 1975:
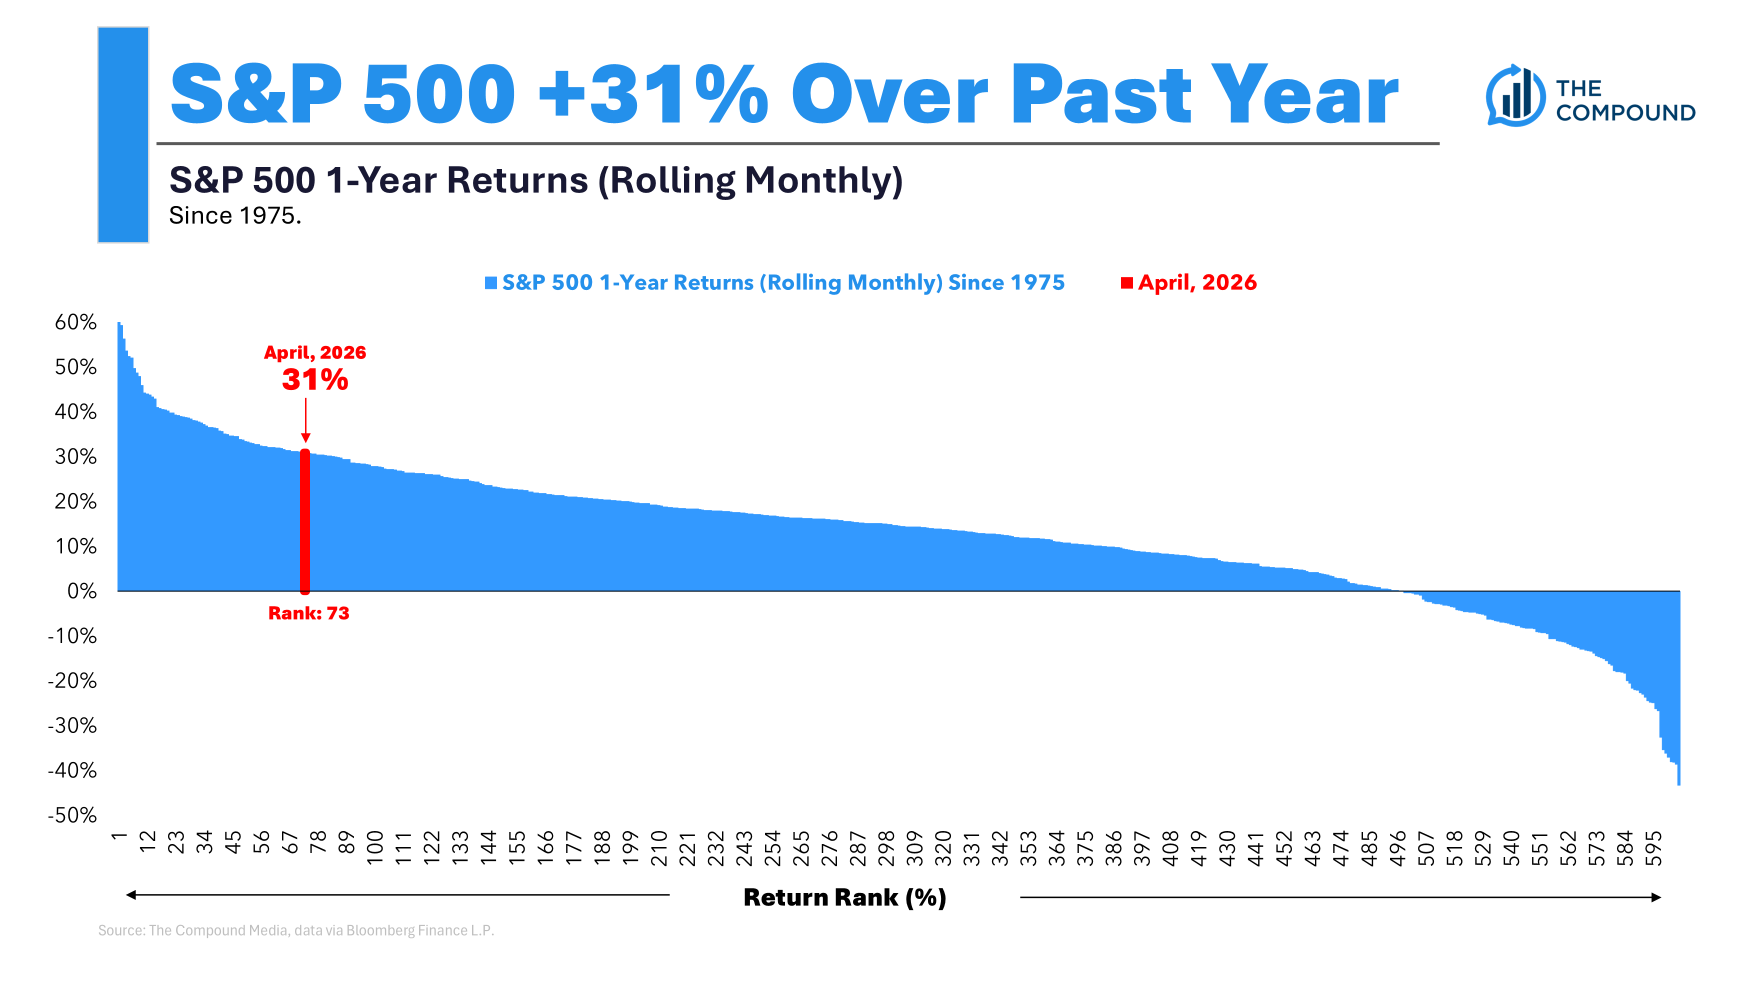
That is a pretty darn good return.
Returns of 40% or more happened 22 different times. The index was up 50% or more in a 12 month period 7 times.
The stock market was down in 17% of 12 month returns. It experienced double-digit losses 8% of the time and was down 20% or more in just 3% of one year returns.
The big question here is what happens to the stock market after a big up year like we just went through.
I looked at the average 12 month returns following a gain of 30% or more in the previous 12 months. It was 11.1%.
So it’s hard to say.
All of the AI earnings growth might be priced in. Maybe this is a melt-up that has further to run.
Predicting the stock market over a 12 month period is nearly impossible because the range of returns can vary so widely.
We covered this question on an all new Ask the Compound live from New York City:
Bill Sweet joined us on the show again this week to tackle questions about why stocks are up, how consumption taxes work, foreign tax credits, how to save for college, retirement planning for small business owners and how to sell low cost basis stocks.
Further Reading:
31 Years of Stock Market Returns
This content, which contains security-related opinions and/or information, is provided for informational purposes only and should not be relied upon in any manner as professional advice, or an endorsement of any practices, products or services. There can be no guarantees or assurances that the views expressed here will be applicable for any particular facts or circumstances, and should not be relied upon in any manner. You should consult your own advisers as to legal, business, tax, and other related matters concerning any investment.
The commentary in this “post” (including any related blog, podcasts, videos, and social media) reflects the personal opinions, viewpoints, and analyses of the Ritholtz Wealth Management employees providing such comments, and should not be regarded the views of Ritholtz Wealth Management LLC. or its respective affiliates or as a description of advisory services provided by Ritholtz Wealth Management or performance returns of any Ritholtz Wealth Management Investments client.
References to any securities or digital assets, or performance data, are for illustrative purposes only and do not constitute an investment recommendation or offer to provide investment advisory services. Charts and graphs provided within are for informational purposes solely and should not be relied upon when making any investment decision. Past performance is not indicative of future results. The content speaks only as of the date indicated. Any projections, estimates, forecasts, targets, prospects, and/or opinions expressed in these materials are subject to change without notice and may differ or be contrary to opinions expressed by others.
The Compound Media, Inc., an affiliate of Ritholtz Wealth Management, receives payment from various entities for advertisements in affiliated podcasts, blogs and emails. Inclusion of such advertisements does not constitute or imply endorsement, sponsorship or recommendation thereof, or any affiliation therewith, by the Content Creator or by Ritholtz Wealth Management or any of its employees. Investments in securities involve the risk of loss. For additional advertisement disclaimers see here: https://www.ritholtzwealth.com/advertising-disclaimers
Please see disclosures here.